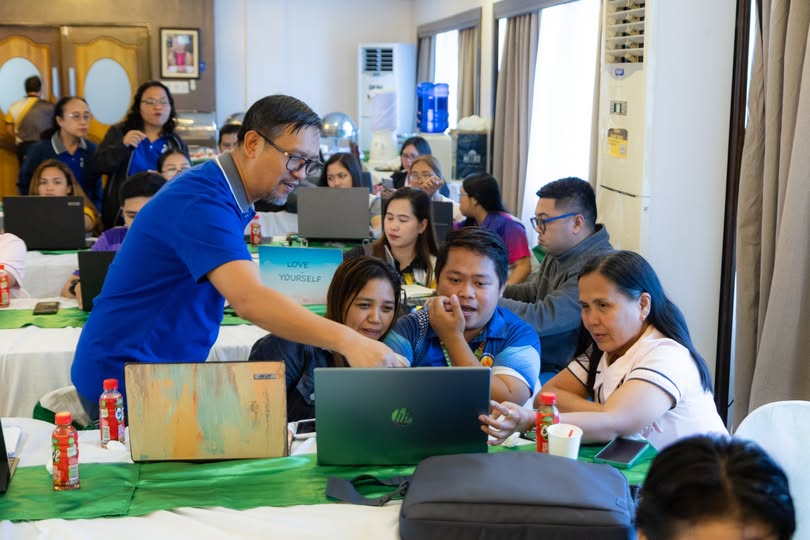
The third and final workshop of SLSU’s Project SULAT was held on October 16, 2025 at the Ataviado Hall in Saint Joseph College.
The workshop focused on harnessing and mobilizing knowledge about Quantitative Data Analysis using the JAMOVI open platform, a free, and community-built program, which is crucial in enhancing research competencies. The program started with an opening remarks by Mr. Jhoremar Asis, Executive Director of the Saint Joseph College – Research Council, and followed by an energizer.
In the workshop proper, Dr. Marvin Taguplo of Southern Leyte State University — Tomas Oppus Campus presented the first two topics of his lecture: Fundamental Data Analysis and Turning Data Into Insights. The first workshop began after the lecture, wherein the teacher-participants engaged in Identifying, Defining, and Measuring Major variables of their study.
The third topic, which was Understanding the JAMOVI open software, after introducing the JAMOVI open software, the teacher-participants had a hands-on approach in using the software, by using artificial data randomization for example usage before using real data from their research studies.
In the afternoon session which started at 1:30 p.m., the participants were setting up the program on their personal laptops. Right after the program had been set up on each of their personal laptops, they were given a walkthrough of the platform on how to effectively utilize its tools; they learned the inferential test for normality and test for normality using the program, with the final output for the day is producing three tables (under the Results and Discussion chapter) being, the Categorical Frequency Distribution Table, the Group distribution with Mean, Stdev, Description, and the Filtered/Split Table, and its data analysis, or interpretation.
Dr. Taguplo emphasized these objectives in analyzing your table data. These are the steps to data analytics which is related to the three tables mentioned above:
– Statistical table data interpretation
1. Descriptive – answers the question What? (What is the result?) (two sentences)
2. Diagnostics – It answers the question Why? (Why is the result like that?)
3. Predictive – answers the question What Now? (So What?) and What If?
4. Prescriptive – answers the question What best practice/action will you sustain or implement, respectively? (two paragraphs)
He noted that it is important to stick with your data, and the results in analyzing your table, and mentioned that the word limit is 90-100 words per paragraph. He also mentioned that what they have done is descriptive statistics.
Project SULAT (Strengthening Understanding and Leveraging Advances of Research Techniques and Technologies), is an extension effort of Southern Leyte State University – Tomas Oppus, it is designed to improve knowledge and skills in writing advanced research and the use of emerging technologies across various disciplines through strengthened professional training and development programs.
_____
Words: Anthony Lompot | The Josephinian


